Simplify your PHP and Symfony monitoring with Jmonitor
Install a PHP worker with Composer and read your stack in ready-made dashboards. No linux agent — everything is PHP.
- Ready-made dashboards
- Cloud or self-hostable
- Open source worker
- PHP collector on Packagist
No credit card required. No time limit on the free plan.
Rather look around first? Sign in to the demo project with demo@jmonitor.io / demo.
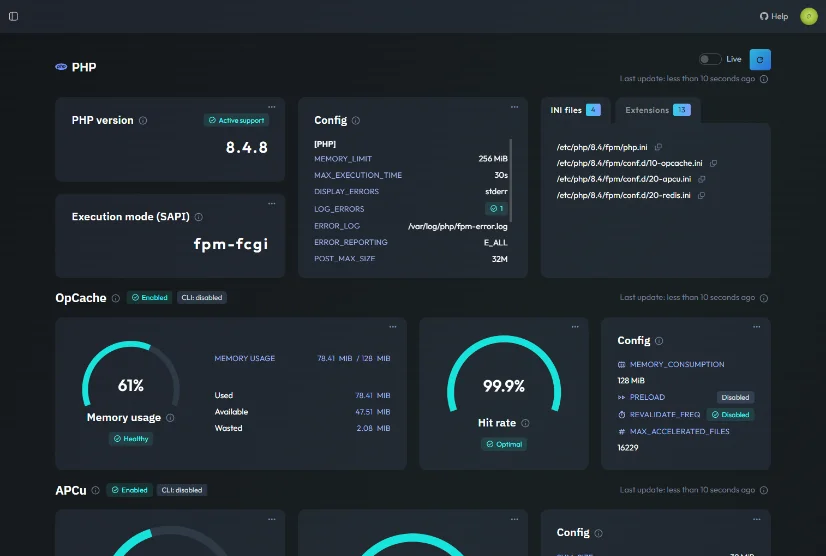
Install it with Composer, run it with PHP.
A small PHP collector library runs as a worker and pushes your metrics. No linux agent, nothing to compile, no configuration language to learn.
Symfony project
Any other PHP project
From install to dashboard
-
1
Install the package (the agent)
One Composer command, on Symfony or on any PHP project.
-
2
Add your API key and collectors
Create a project, take its API key, and pick the collectors you need — MySQL, Redis, Apache, PHP, System… On Symfony the bundle wires them for you.
-
3
Run the worker
The collector runs as a separate CLI process, kept alive by a process manager like Supervisor or systemd. Nothing to compile.
-
4
Read your dashboards
Metrics are pushed as they are collected — the dashboards are already built for each component.
What you get, out of the box
Dashboards, alerts and charts you can read without being a monitoring expert.
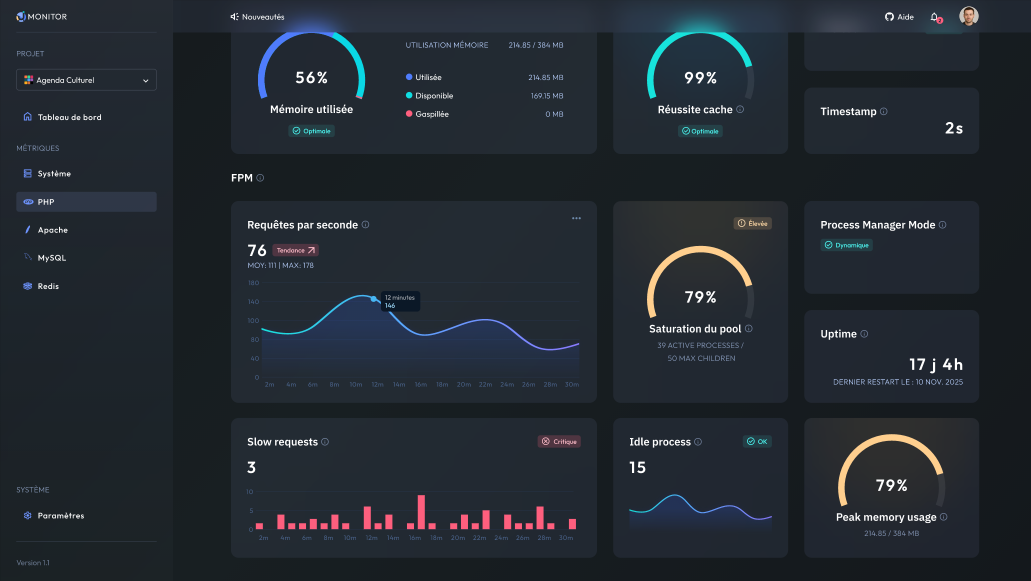
Ready-made dashboards
One dashboard per component — PHP, Apache, Nginx, MySQL, PostgreSQL, Redis, Symfony and the host. Nothing to build.
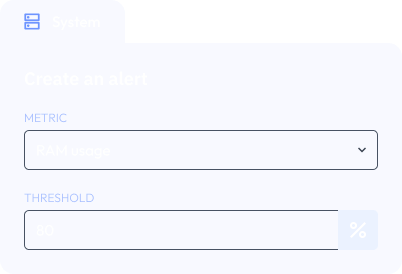
Flexible threshold alerts
No query language. Pick a metric, set a threshold, and get an email when it is crossed.
Charts that explain
Each metric comes with standard thresholds and a plain explanation of what it means when it moves.
Live demo
Look around before installing anything
A demo project is open to everyone, with every dashboard and every component enabled — exactly what you get on your own servers. Sign in with the shared credentials, no account to create.
Two ways to run it
Same dashboards, same components, same open source worker. You only choose where your data lives.
Cloud
Hosted by us
Nothing to host, nothing to maintain — online in 2 minutes.
- Updates, backups and metric storage handled for you.
- Free plan with no time limit.
- Alerting, history charts and embeds on paid plans.
Self-hosted
Hosted by you
Free and open source, forever. No account needed.
- Your metrics never leave your servers.
- No feature held back — same dashboards, same components.
- Free and open source. Review every line of what you run.
Follow the setup guide on Docker Hub.
| Same product | Cloud | Self-hosted |
|---|---|---|
| Dashboards and components | All of them | All of them |
| Where your data lives | Our servers | Your servers |
| Updates, backups, storage | Handled for you | Up to you |
| Data retention | Depends on your plan | Your choice |
| Price See all plans | Free, or €5 to €10/Month | Free, open source |
FAQ
Both run the same Jmonitor, with the same dashboards and the same components. The only real difference is who hosts it.
Choose the cloud if you want to be monitoring in minutes with nothing to maintain. Choose self-hosting if your metrics have to stay on your own infrastructure.
This application is designed for web developers, small teams, and technical (or not !) managers who want to understand the health of their servers without being monitoring experts.
It is ideal for people who do not have the time or the desire to install, configure, and maintain multiple complex monitoring tools, and who want a single, simple solution that just works.
Metrics are regularly pushed from a lightweight worker running on your server.
The worker is written in PHP and is fully open source, so you have full control and complete transparency over what is collected. You can easily review the code and see exactly which metrics are gathered before they are sent to the application.
The tool focuses on common web server stacks and system components, including PHP, Apache, Nginx, MySQL, PostgreSQL, Redis, Symfony, Caddy (& FrankenPHP), and the host operating system.
Each service has its own dedicated dashboard with carefully selected metrics that highlight performance, resource usage, and potential problems in a simple and consistent way.
This tool focuses on simplicity and clarity rather than exhaustive configurability.
Unlike complex monitoring stacks that require multiple components, long setup phases, and ongoing maintenance, it provides ready-to-use dashboards with carefully selected metrics that are easy to understand.
Yes. The self-hosted version is free and open source, and the cloud includes a free plan with no time limit.
In the cloud, paid plans unlock additional components and features such as extended metric history and alerting.
With the free plan, you can monitor up to 3 projects; higher limits are available with paid plans.
Up and monitoring
in minutes
Try Jmonitor for free in the cloud, or pull the Docker image and run it on your own servers.
See the health of your servers and stack in one place.