Monitoring made understandable
Jmonitor provides on-demand documentation for every metric, helping you understand and optimize your server and app performance without (too much) complexity.
Contextual Knowledge, Everywhere
Look for the help icon throughout the dashboard to access instant documentation.
Whether it's a specific metric, a configuration key, or a stack component, a single click opens a side panel with the clear explanations you need to take action.
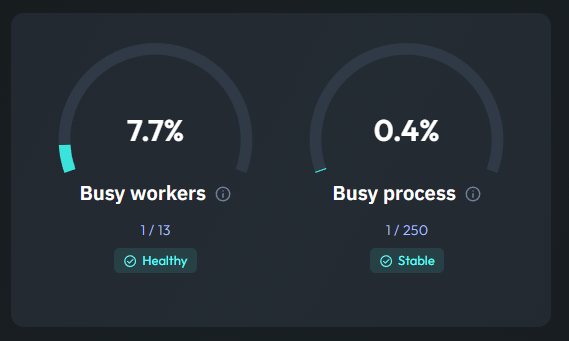
Metric help
Each gauge or chart comes with contextual guidance explaining what the data represents, what values are considered healthy, and how to react to spikes or anomalies.
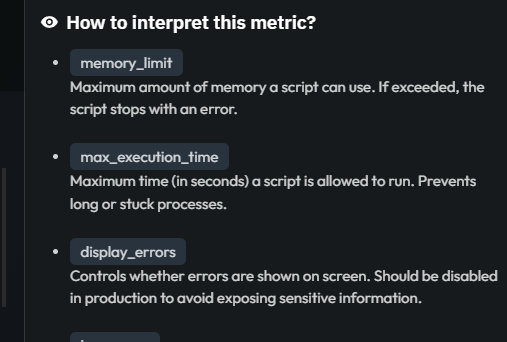
Configuration help
Every configuration parameter is documented inline. Understand exactly what each field controls and how it affects your monitoring setup without leaving the dashboard.
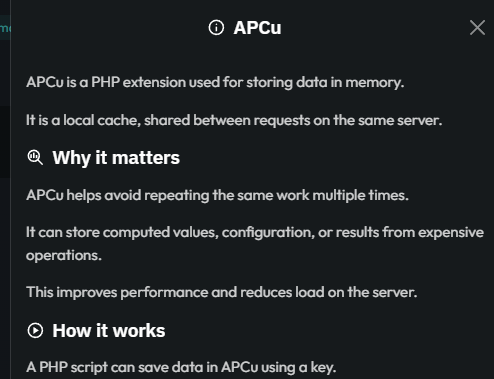
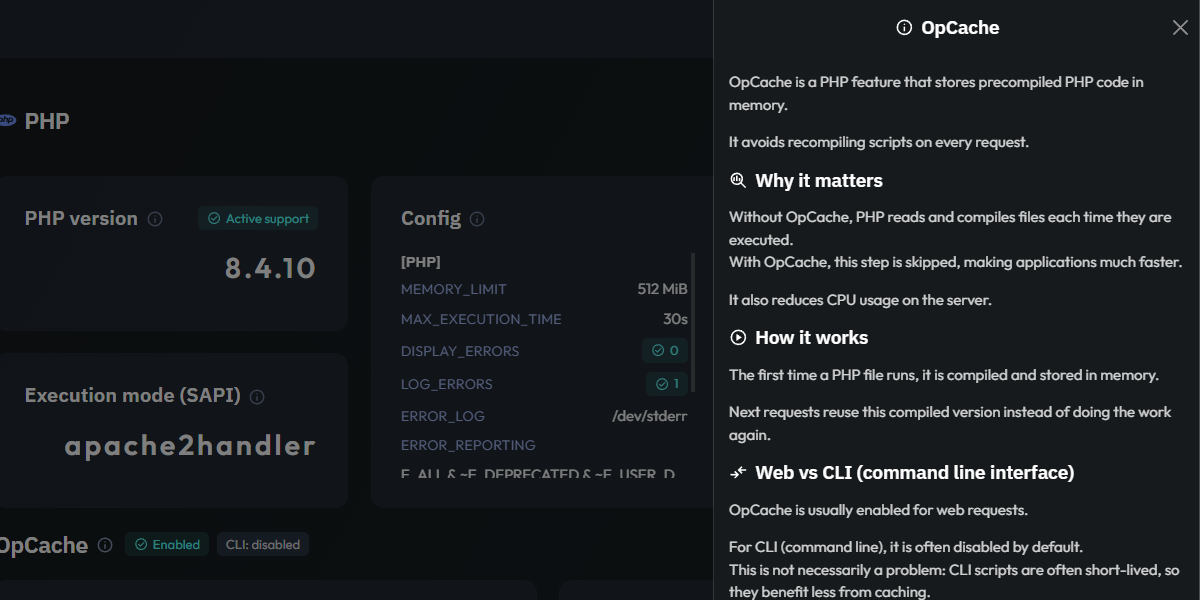
Component subsection help
Complex components like PHP are broken down into logical subsections (APCu, OPcache, etc.). Each one includes dedicated help to explain its specific role and metrics.
Every help follows the same structure
Consistent sections, so you always know where to look.
Definition
A clear and concise explanation of the metric or component.
This section provides the foundational knowledge needed to understand what is being monitored, without the technical jargon.
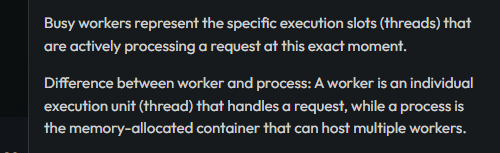
Why it matters
Every metric has a purpose.
We explain the real-world impact of each indicator on your application's health, helping you prioritize what deserves your attention.

How to interpret
Graphs can be complex.
This section guides you through the data, explaining how to read the trends and what the relationship between different values actually signifies.

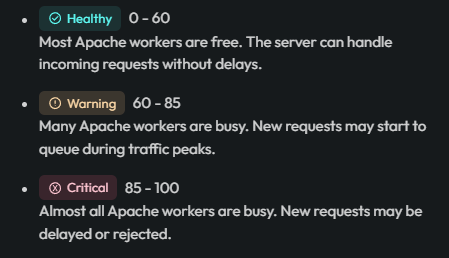
Typical ranges
Know at a glance if your numbers are healthy.
We define standard thresholds for "Good", "Warning", and "Danger" states, providing a reliable benchmark for your environment.
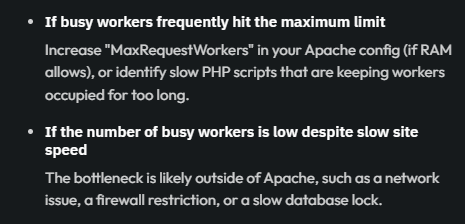
Recommended actions
Turn data into decisions.
Whether you’re facing a sudden spike or a consistent bottleneck, Jmonitor suggests practical steps to investigate, troubleshoot, or optimize your setup.
Good to know
Additional tips and expert insights.
This part covers subtle nuances, edge cases, or helpful shortcuts that can help you master your stack’s behavior over time.