Simple Caddy monitoring
Keep your Caddy server running at peak performance. Visualize your traffic and response times instantly, whether you are serving static files or handling dynamic PHP requests.
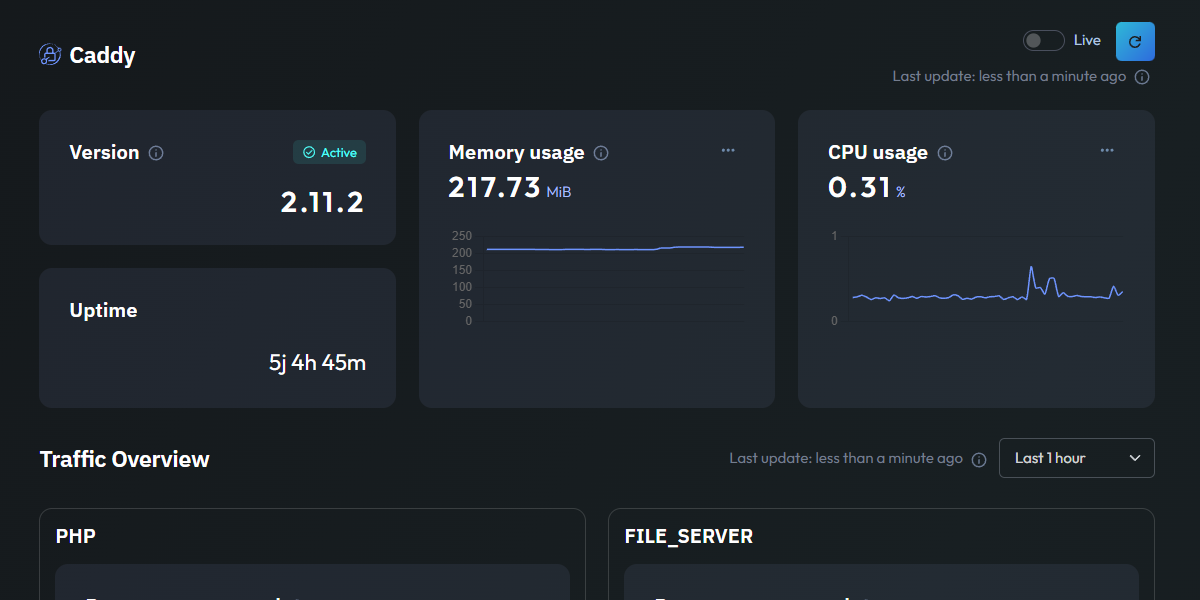
Essential Caddy metrics
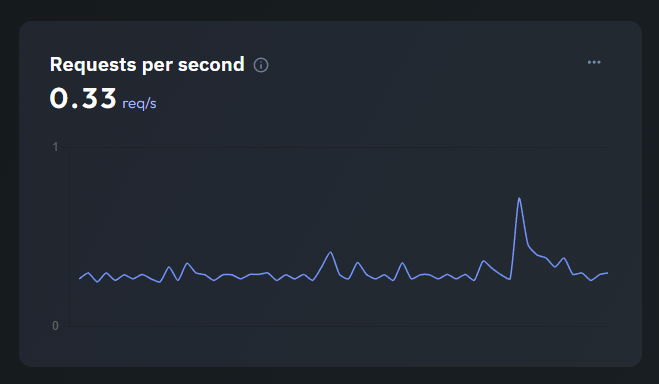
Throughput per Handler
Monitor your incoming traffic volume in real-time. This chart displays requests per second for a specific handler, such as the PHP handler or the file_server, allowing you to isolate and analyze the load on different parts of your stack.
This granular visibility helps you understand exactly how your server handles concurrent visitors and identifies specific usage patterns without any complex configuration.
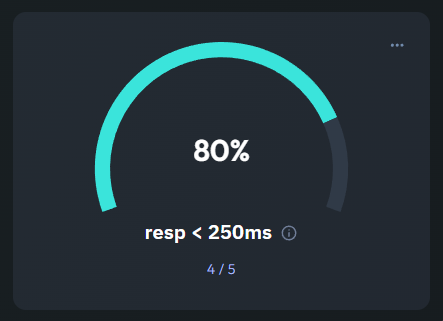
Response Health Score
Response time directly affects user experience. This gauge shows the percentage of requests completed in under 250ms, giving you an immediate "health score" of your server's responsiveness at a glance.
To provide deeper insights, Jmonitor also tracks average request and response durations, helping you spot latency issues before they impact your SEO or conversion rates.
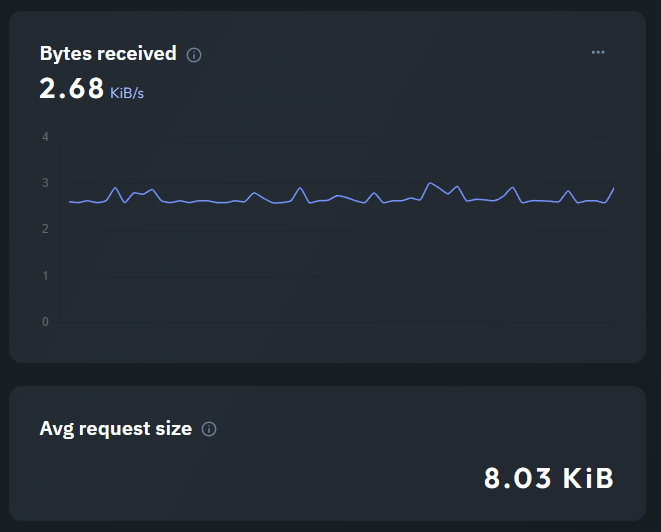
Bandwidth & Payload Size
Track your data consumption with a clear view of Bytes Received. This line chart helps you understand the data load your server is processing and monitors your overall bandwidth usage in real-time.
Combined with the average request size in KB, you can easily detect unusual upload patterns or heavy payloads that might be slowing down your network performance.