Simple system monitoring
Keep your server resources under control. Monitor the vital signs of your host machine to ensure your applications always have the power they need to perform.
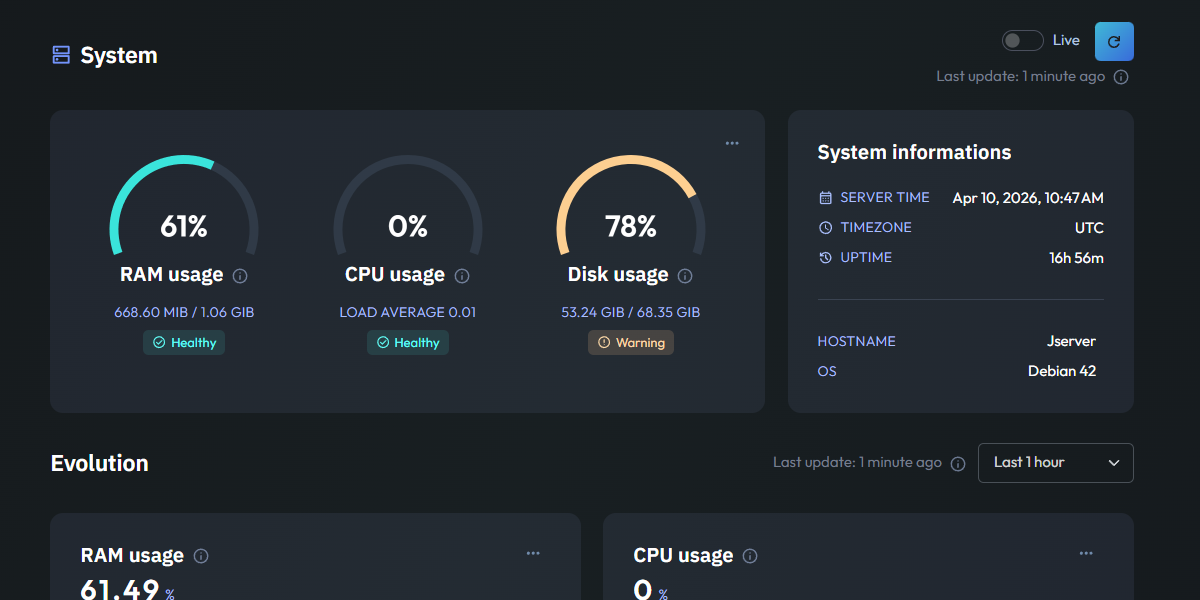
Essential System metrics
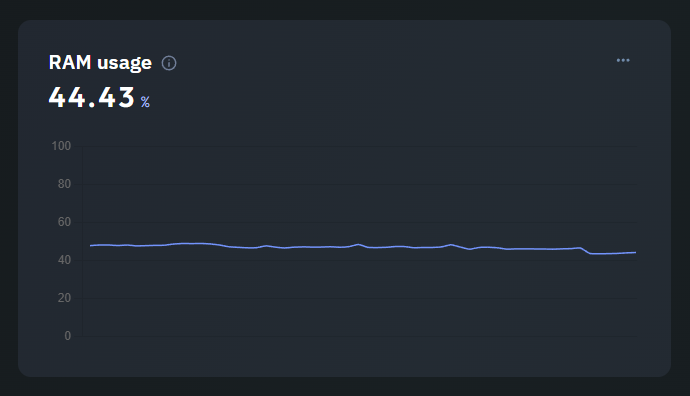
RAM Usage Over Time
This line chart tracks your RAM Usage percentage in real-time. It allows you to visualize how much memory your system is consuming and helps you identify memory leaks or periods of high pressure that could lead to swap usage.
By monitoring memory trends, you can proactively decide when it's time to upgrade your resources or optimize your applications before the system runs out of memory and starts killing processes.
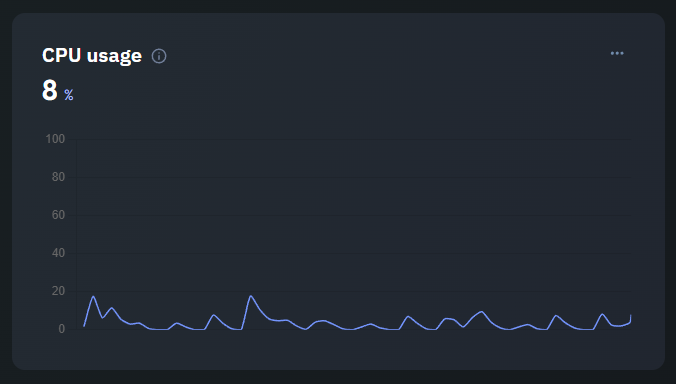
CPU Load & Activity
Track your server's CPU Usage percentage with this chart. It shows exactly how much of your processing power is being used by your running tasks and services.
Persistent high CPU usage can lead to latency and slow response times. This chart helps you distinguish between normal activity spikes and a server that is consistently overloaded, helping you keep response times low.
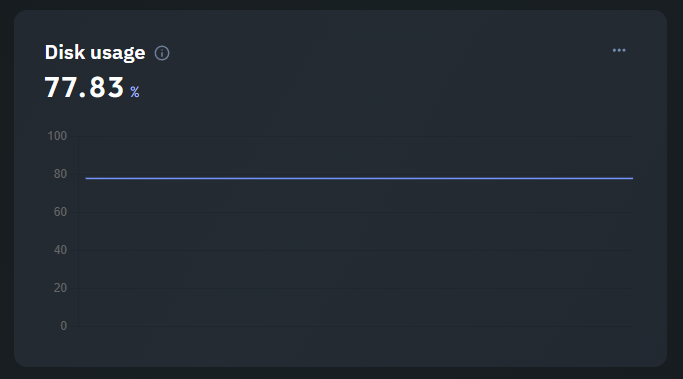
Disk Space Monitoring
Running out of disk space is a common but preventable cause of server failure. This chart tracks your Disk Usage percentage, giving you a clear view of how much storage remains available for your logs, databases, and files.
Visualizing your disk consumption over time helps you predict when you'll reach capacity. It allows you to manage log rotation or expand your storage well before a full disk takes your server offline.