Simple Apache monitoring
Get real-time visibility into your Apache server's health. Understand your traffic and resource usage instantly, without digging through complex log files.
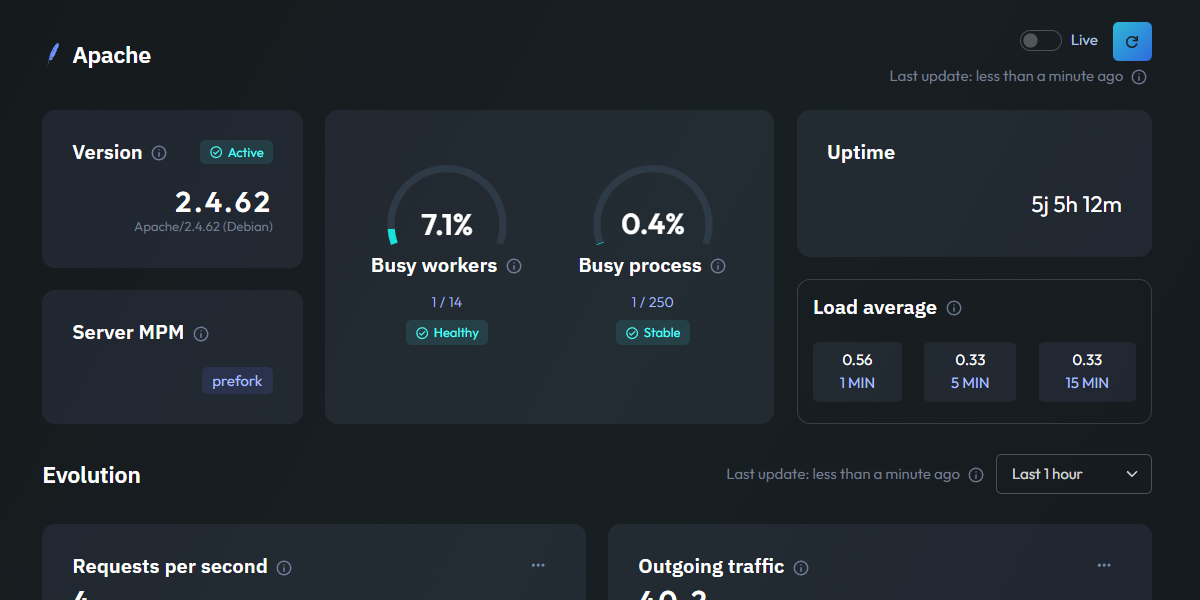
Essential Apache metrics
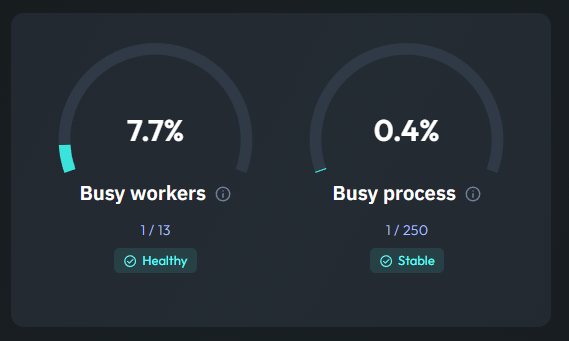
Active Server Capacity
This metric shows you exactly how hard your Apache server is working at any given moment. By tracking Busy Workers and Processes, you can see how many simultaneous connections your server is currently handling compared to its maximum capacity.
Monitoring this is crucial for preventing downtime. If your workers are consistently near their limit, it's a clear signal that your server might need more resources or a configuration tweak to stay responsive during traffic spikes.
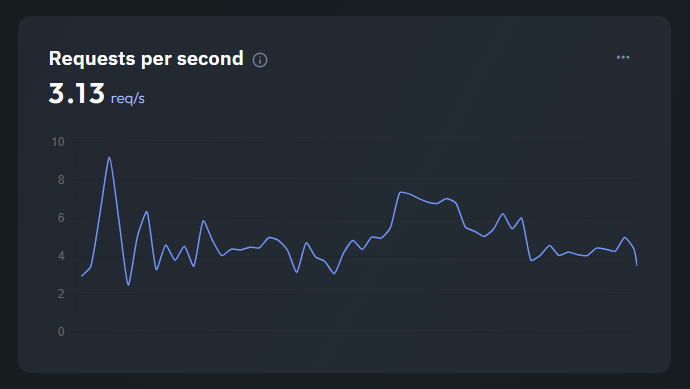
Requests per Second
Understand the volume of incoming traffic with a real-time view of Requests per Second. This line chart helps you visualize peak hours and identify sudden surges in activity that could impact your users' experience.
It's a simple way to correlate site performance with user behavior. A steady line means stability, while spikes help you pinpoint when your infrastructure is under heavier load.
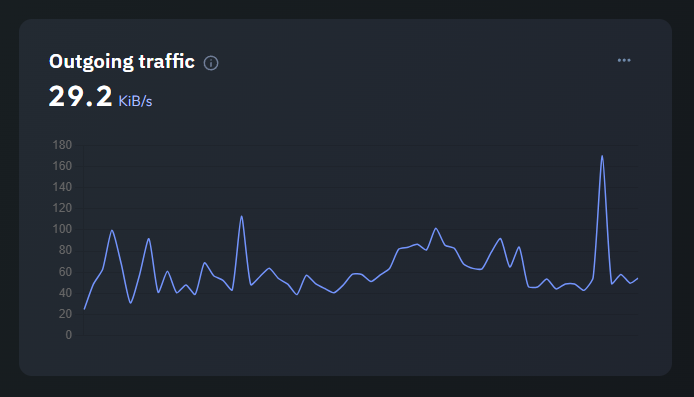
Bandwidth Consumption
This chart tracks your Outgoing Traffic in KB/s, giving you a clear picture of how much data your Apache server is sending to clients. Whether it's serving static assets or dynamic PHP content, you'll see the bandwidth impact in real-time.
Monitoring outgoing traffic also helps you identify unoptimized assets or unexpected data leaks, and keep your hosting costs and performance under control.