Simple Redis monitoring
Keep your in-memory data store under control. Visualize your Redis health in real-time to ensure fast response times and efficient memory allocation for your applications.
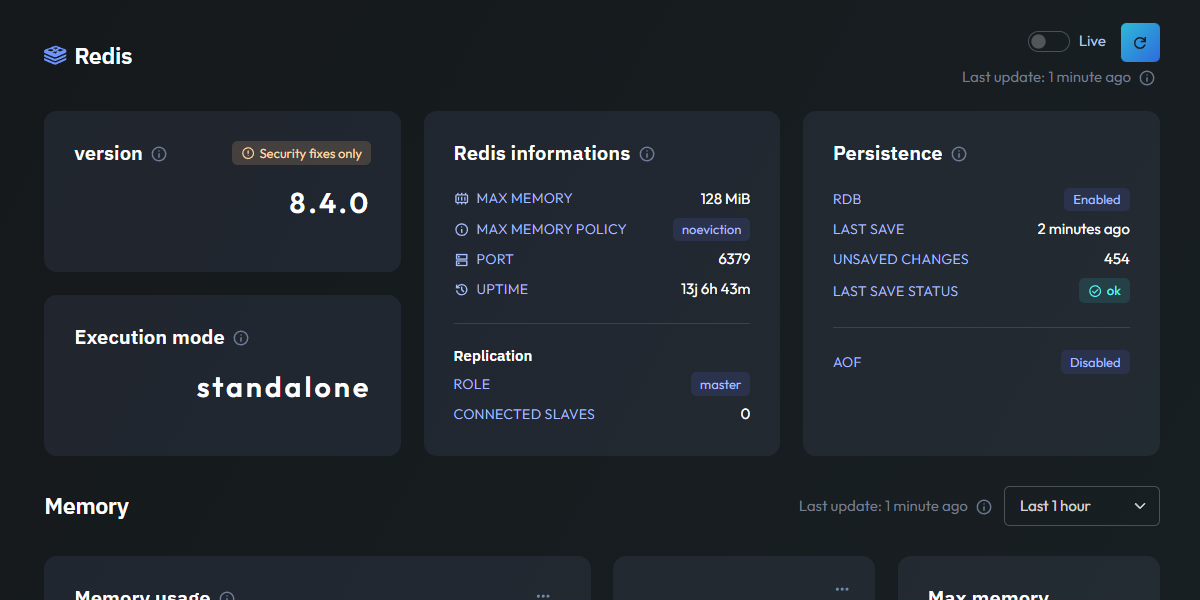
Essential Redis metrics
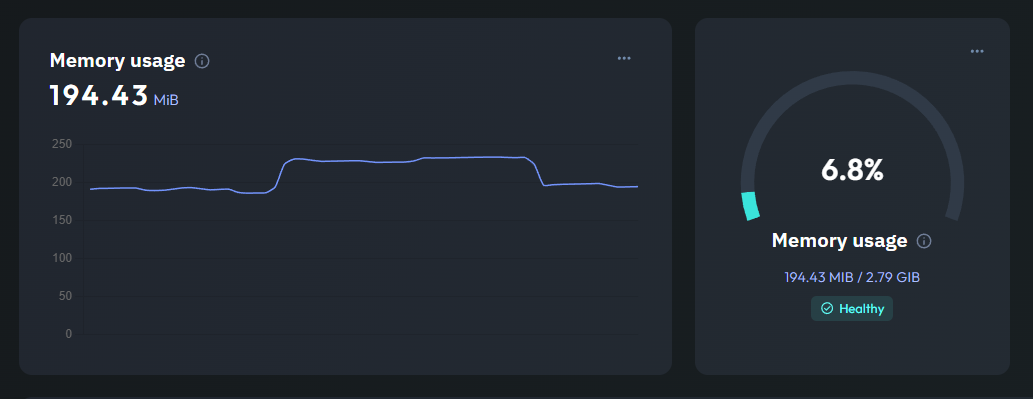
Memory Consumption
As an in-memory database, monitoring RAM is critical. This section combines a line chart and a gauge to track your Memory Usage in real-time, helping you ensure that your data fits comfortably within your server's limits.
Seeing the evolution of memory over time allows you to detect memory leaks or unexpected data growth. It gives you the insight needed to adjust your eviction policies or upgrade your hardware before reaching the "out of memory" threshold.
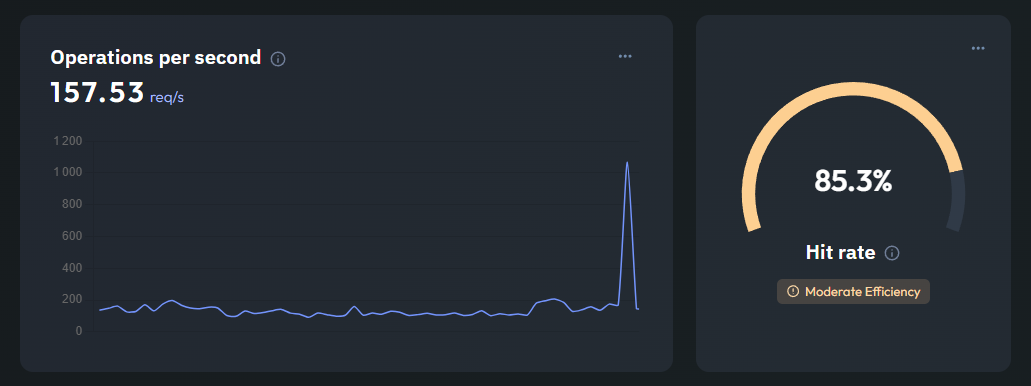
Operations & Cache Hit Rate
Understand the intensity of your Redis workload with the Operations per Second chart. At the same time, the Hit Rate gauge tells you the percentage of lookups that successfully find a key in the cache.
A high hit rate is the sign of a healthy cache. If this number drops, it means your application is frequently missing the cache and potentially hitting your main database, which can slow down your entire stack.
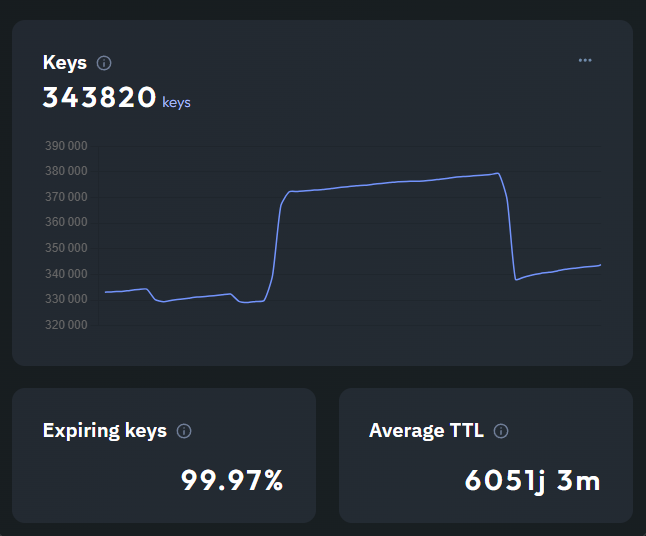
Database Keys & TTL
This specific view allows you to dive into your database structure. Track the total Number of Keys and see how many are set to expire. The Average TTL (Time To Live) gives you a clear idea of how long your data typically stays in memory.
Monitoring expiring keys is essential for maintaining a clean and efficient database. By visualizing these metrics, you can ensure that your caching strategy is working as intended and that your server isn't being cluttered with stale data.