Simple PostgreSQL monitoring
Keep your database fast and reliable under load. Visualize your PostgreSQL health in real-time with clear indicators of cache hit ratio, connection usage, slow queries, and transaction throughput.
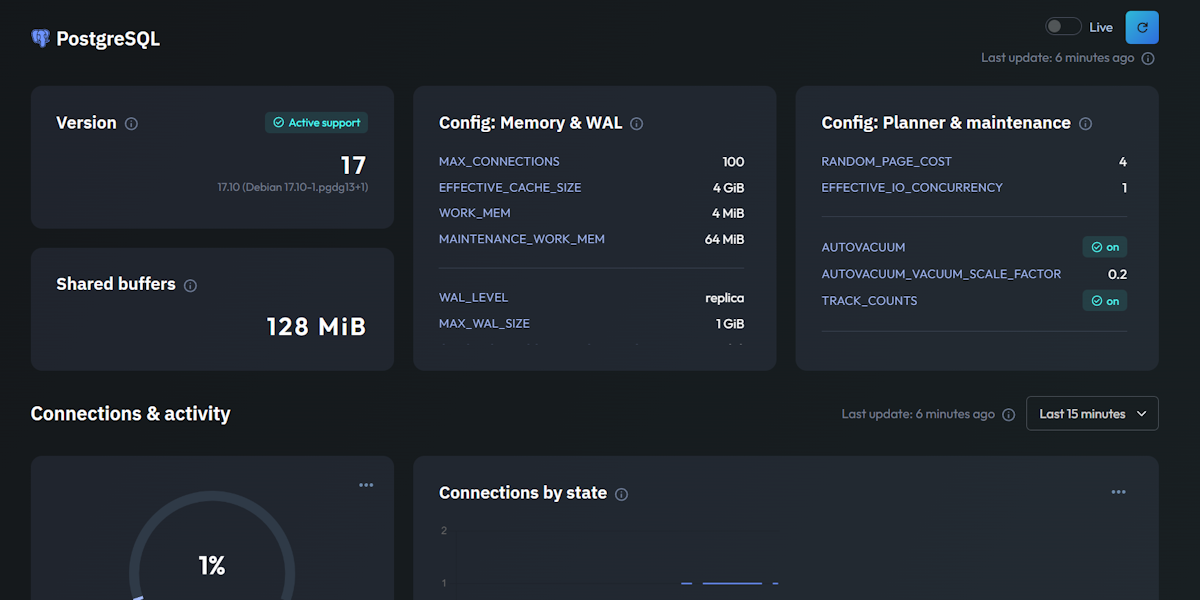
Essential PostgreSQL metrics
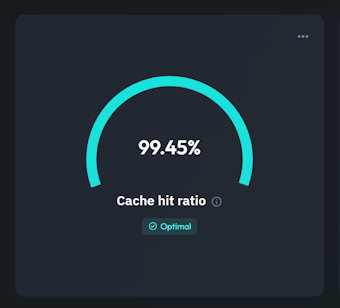
Cache hit ratio
In PostgreSQL, performance starts in memory. The Cache Hit Ratio shows the percentage of data blocks served directly from the shared buffers instead of being read from disk — and on a healthy database, this number should stay above 99%.
When the ratio drops, it means your queries are increasingly hitting the disk, which is orders of magnitude slower than RAM. Tracking it over time helps you decide when to tune your shared_buffers or add memory, before your users start feeling the slowdown.
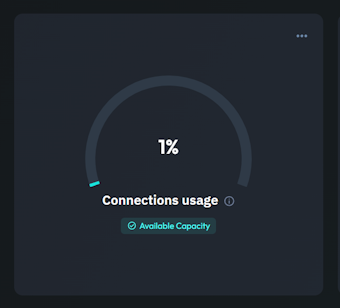
Connection usage
Unlike many databases, PostgreSQL spawns a dedicated process for every connection, which makes connection management a real concern. This gauge shows how many of your max_connections slots are currently in use, so you can spot saturation before it triggers the "too many clients already" error.
If you regularly approach the limit, it's usually a sign that you need a connection pooler like PgBouncer rather than simply raising the ceiling. Monitoring this metric tells you exactly when that moment has come.
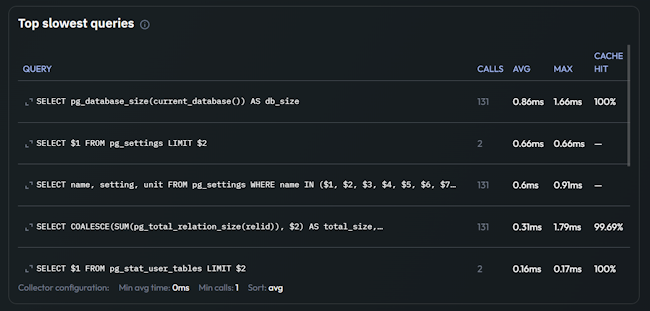
Slow queries
Most performance problems trace back to a handful of expensive queries. Jmonitor surfaces your Slow Queries in a clear ranking, so instead of digging through logs you immediately see which statements consume the most time on your database.
With the worst offenders laid out in front of you, optimization becomes straightforward: add the missing index, rewrite the join, or cache the result. Fixing the top queries is almost always the fastest path to a snappier application.
Transactions
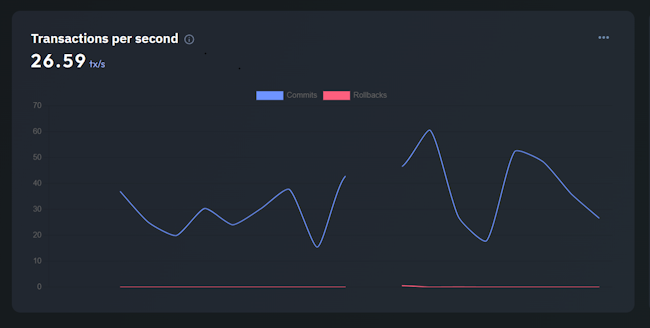
Track the real workload of your database with the Transactions chart, which plots commits and rollbacks per second over time. It gives you a live view of how busy PostgreSQL is and how that activity evolves with your traffic.
A rising rate of rollbacks is especially worth watching: it often reveals failing transactions, deadlocks, or application errors that would otherwise go unnoticed. Seeing commits and rollbacks side by side helps you catch these issues early and keep your data layer healthy.